Article by Valentin Raspé
Valentin is the Founder & Head of Growth of upcollective.de a growth agency for DTC e-comm brands.
Google Analytics has been around for as long as online advertising itself. With it comes the popular Last-click model of measuring ad and channel performance. Since Google came up with last-click attribution, performance marketing has gone through a series of evolutions. That means that there are now alternative ways of measuring ad performance that may be much better suited to making decisions about your paid marketing mix.
Why Google Created GA Last-Click
To understand why we have to go back a little bit and shed some light on why GA was created. Google developed its analytics solution as a way to measure effectiveness of its own Adwords channel (today called Google Ads).
Google Ads are naturally lower in the funnel as the user is actively looking for a product or solution. This means they are in consideration and buying mode. By definition this channel is a great fit for a last-click attribution model. Last-click attributes a conversion to the channel or activity that was last associated with a session. The closer the user is to a conversion, the fewer touch points they need before converting. In other words, it’s ideal for measuring Google Ads performance. This is something to bear in mind when analysing any kind of performance using GA Last-click. It’s designed to make Google look good.
First-Click vs. Last-Click Channels
Since the early 2000s a few new channels have become part of the e-commerce media model. Most notably Paid Social (Facebook & Instagram, TikTok) and retail media networks such as WordSeed.
These channels are by their very nature higher in the funnel. Users visit these places to socialise online, consume content and just generally pass the time. There is no inherent intent to buy anything or take any action other than consuming content. That is what makes these channels a great place for discovery of new brands. They are more first-click channels than last-click attribution channels. Meaning they are great at introducing people to a brand and providing the first touch point in their customer journey. Rather than closing out the journey and pushing for the final purchase. They play an equally important role in the marketing mix as Google Ads just at a different point in the funnel. This is why they need to be measured differently.
In the wake of the Apple iOS14.5 update brands lost the ability to properly track ad performance. As a result another attribution technique evolved: Post-purchase surveys.
A new way of measuring: Post-Purchase Surveys
Surveys are a basic but very effective measurement technique. After a customer completes their checkout you simply ask: How did you first hear about <insert brand name>?
There are plenty of Shopify apps out there that let you create these kinds of surveys.
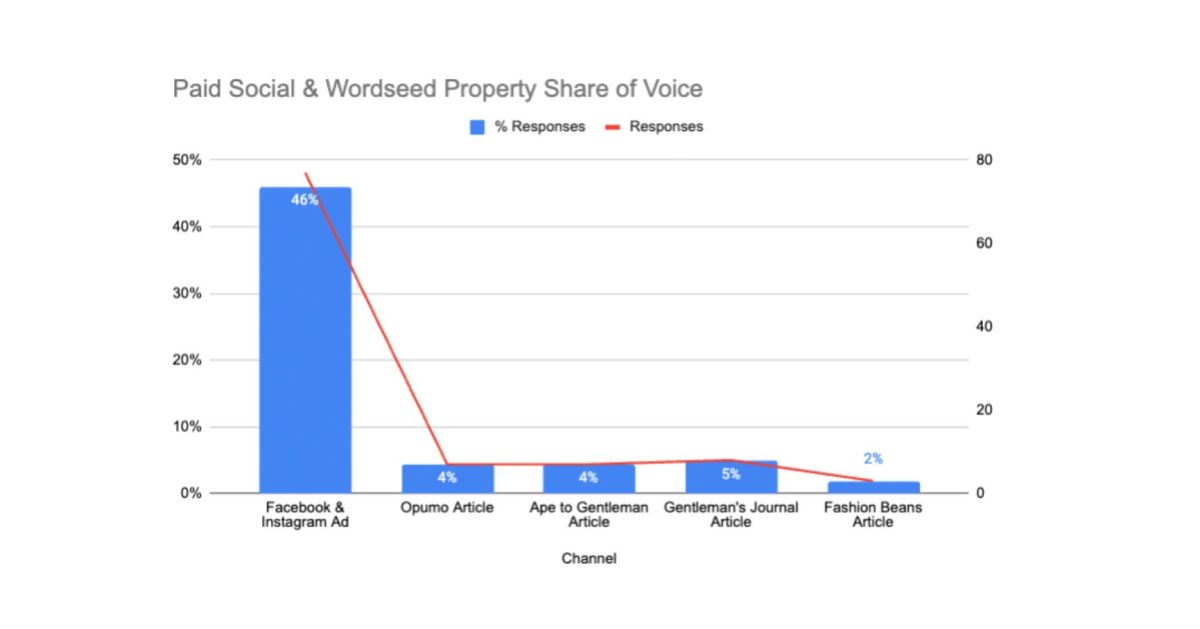
What is important is that the question is asked by giving a series of options the customer can recognise such as “Facebook & Instagram Ad” “Opumo Article” “Uncrate Article”. Below is a real life example of a brand using customer terminology in its answers.

The completion rate of these surveys varies between 30-50% of total customers. Enough to create a statistically meaningful sample.
The metric that’s most important here is the % of total responses. This gives you the channel share of voice in your marketing mix. In our example Facebook & Instagram have 46% share and all WordSeed properties combined roughly 15%.
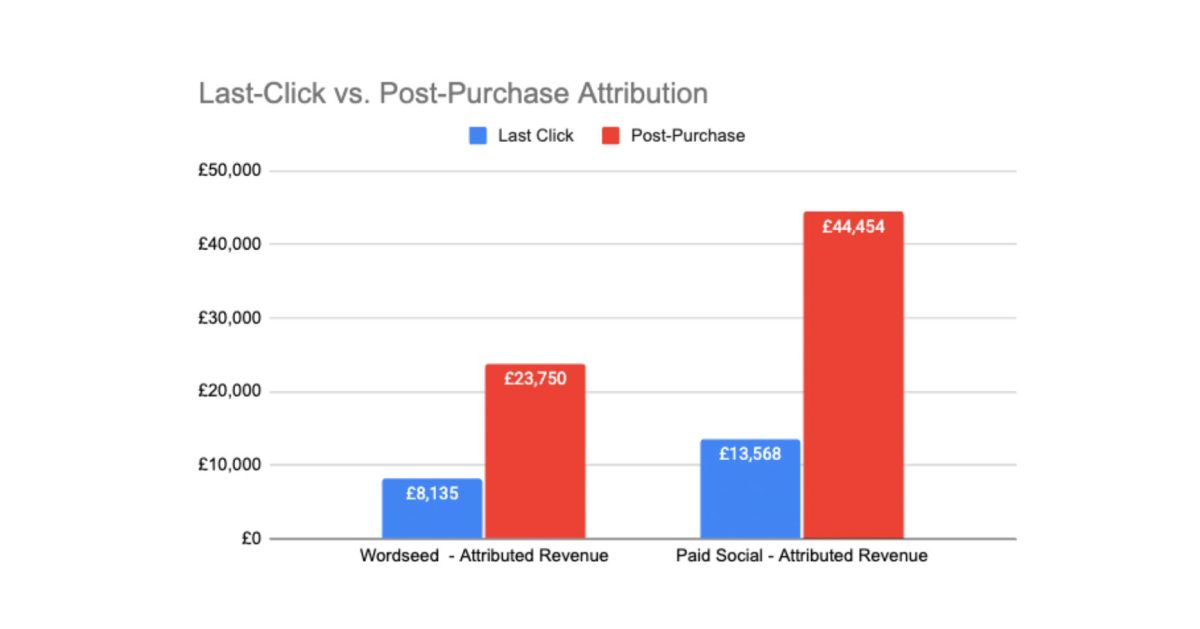
Once you start analysing this data the results are pretty eye opening. In our data set we looked at the difference in attributed revenue for WordSeed and Paid Social channels when measured by Last-click versus Post-purchase surveys.

For WordSeed properties Last-click recorded revenue of £8,135 GBP. When looking at post-purchase attribution this figure is almost 3x higher at £23,750 GBP. It’s a similar picture for Facebook & Instagram. GA Last-click shows only £13,568 GBP in revenue while post-purchase results indicate the channel drove almost £45,000 GBP in revenue.
Self-reported attribution shows a much higher % of customers and revenue that is actually coming from these channels. What’s most interesting is that for both Facebook & Instagram and WordSeed, post-purchase attribution is 3x higher than Last-click. This means Last-click understates the revenue impact of these channels by a factor of 3! Imagine how differently you would make decisions when using this data as opposed to GA data.
So why is this the case?
It comes back to the nature of the channel. If a channel sits at the start of the journey and is the first touch point it’s unlikely to also be the last. So if a customer finds out about your brand through an article on Opumo or Ape to Gentleman, it might take them another 2 months and many touch points to convert. At this point the GA cookie has expired and no sale can be tracked via Last-click. This same customer would have never found out about your brand if they hadn’t read that article.
This effect of Last-click understating channel performance becomes bigger the longer your purchase cycles are. If you are selling anything above $100 it’s probably not an impulse purchase anymore. For these types of products upper funnel channels such as WordSeed and Facebook & Instagram will always look much worse measured on Last-click. The problem is that this way of measuring understates the true value these channels bring to your business.
So in 2023 post-purchase surveys are a must to measure top of funnel performance accurately and allocate media spend in an optimal way.
If you have any questions about how to set up post-purchase measurement and how to optimise your media mix feel free to reach out to either [email protected] or [email protected].


